|
|
|
|
|
|
|
Category Returns
|
|
|
|
MF Scheme SnapShots |
|
Check out details of a particular scheme along with the latest NAV for various time
periods. You can widen your search on the basis of the Fund House, Category and
particular Scheme
|
|
|
|
|
|
|
|
|
|
|
|
|
|
|
|
|
|
|
|
|
|
|
|
|
|
|
Groww Banking & Financial Services Fund-Reg(G)
|
|
|
|
Summary
|
|
|
Fund Name
|
Groww Mutual Fund
NA |
|
Scheme Name
|
Groww Banking & Financial Services Fund-Reg(G)
|
|
AMC
|
Groww Asset Management Limited
|
|
Type
|
Open ended scheme
|
|
Category
|
Equity - Sectoral Fund - Banks & Financial Services
|
|
Launch Date |
06-Feb-24
|
|
Fund Manager
|
Anupam Tiwari , Saptarshee Chatterjee , Nikhil Satam , Hitesh Das
|
|
Face Value
|
10
|
|
Custodian |
HDFC Bank Limited
|
|
Net Assets (Rs. cr)
|
106.79
|
|
|
|
|
AMC Details |
|
Groww Asset Management Limited
|
|
Vaishnavi Tech Park, South Tower, 3rd Floor, Survey No.16/1 and 17/2,
|
|
Ambalipura Village, Varthur Hobli, Bellandur, Bangalore South
|
|
Bangalore - 560103
|
|
Phone :
022-6974 4435
|
|
Fax :
022-66589925
|
|
support@growwmf.in
|
|
https://www.growwmf.in
|
|
|
|
|
|
|
|
|
|
|
|
|
NAV Details
|
|
|
|
NAV Date
|
23-Oct-26 |
Max Entry Load %
|
0.00 |
|
NAV [Rs] |
11.55 |
Max Exit Load %
|
1.00 |
|
Buy/Resale Price [Rs]
|
11.55 |
52 Week High[Rs] |
13.30 (26-Aug-26) |
|
Sell/Repurchase Price [Rs]
|
11.55 |
52 Week Low[Rs]
|
10.52 (31-Mar-26) |
|
|
|
NAV Graph |
|
|
|
|
|
|
|
|
|
|
|
|
|
|
|
|
|
|
|
Investment Details
|
|
Objective |
| The primary investment objective of the scheme is to generate consistent long-term returns byinvesting in equity and equity-related instruments of banking and financial services companies andother related sectors/companies. The fund aims to capitalize on the growth opportunities and growthpotential of various sub-sectors within the BFSI sector, including (but not limited to) banks, NBFCs,insurance companies, asset management companies, capital market participants, fintech players etc. (This includes companies benefiting from or contributing to the growth of the banking and financial services sector). |
|
|
|
Min. Investment (Rs.)
|
500 |
|
Increm.Investment (Rs.)
|
500 |
|
|
|
Investment Pattern |
| Type | Minimum % | Maximum % | | Equity & equity related instruments of companies engaged in financial services sector | 80 | 100 | | Other Equity & Equity related instruments | 0 | 20 | | Debt & MMI | 0 | 20 | | Units of REITs & InvITs | 0 | 10 |
|
|
|
|
SIP Details |
|
|
SIP MIN Investments(Rs.) |
100 |
|
SIP Incremental Investments(Rs.) |
1 |
|
SIP Frequency |
Daily |
|
No.of Investments Cheques
|
|
|
|
|
|
|
|
|
|
Ratio
|
|
Statistical Ratios |
|
|
|
Beta [%] |
1.0005
|
|
Sharpe Ratio [%] |
-0.0632
|
|
R-Square [%] |
0.7878
|
|
Expense Ratio [%] |
2.9900
|
|
AVG Ratio [%] |
-0.0459
|
|
|
|
|
|
Other Ratios |
|
|
|
Treynor Ratio [%] |
-0.0135
|
|
Turnover Ratio [%] |
1.4400
|
|
FAMA Ratio [%] |
0.0350
|
|
SORTINO Ratio [%] |
-0.1145
|
|
|
|
|

|
What is Standard Deviation?
Standard Deviation is the measure of the deviation in the returns of the portfolio. In Simple Words it tells us how much the return on the fund is deviating from the expected normal return.
|
|
|
What is Jenson's Alpha?
It measures whether the Scheme is generating excess returns over the normal returns.For example, if there are two mutual funds that both have a 12% return, a rational investor will want the fund that is less risky.If the value is positive, then the portfolio is earning excess returns. In other words, a positive value for Jensen's alpha means a fund manager has 'beat the market' w with his or her stock picking skills. The Higher the value the better the performance.
|
|
|
|
|
|
|
Portfolio Analysis
|
|
Allocations As on
30-Sep-2026
|
|
|
|
Fund Size :
106.79
(Cr.) |
|
|
|
 |
|
 |
|
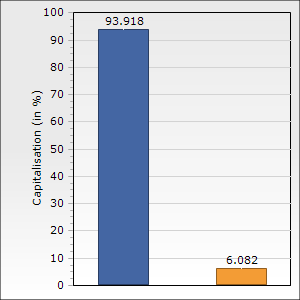
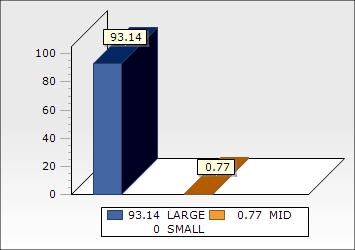
Market cap-wise Allocation Style |
|
|
|
Average Mkt Cap (Rs Cr) |
93326.75
|
|
Market Capitalization |
% of Portfolio
|
|
Large |
88.91
|
|
Mid |
2.76
|
|
Small |
3.51
|
|
Note: Large-Cap = 5000 Crs. and above, Mid-Cap = 2000 Crs. to 5000 Crs. and
Small-Cap = less than 2000 Crs. |
|
|
|
|
|
|
Portfolio Concentration |
|
|
% Net Assets
|
|
Top 3 Sectors |
NA |
|
|
|
+ - Top 5 Holdings |
21.81 |
| Kotak Mahindra Bank | 4.63 | | Axis Bank | 4.46 | | Tri-Party Repo (TREP | 4.34 | | Multi Commodity Exch | 4.21 | | CarTrade Tech | 4.18 |
|
|
+ - Top 10 Holdings |
39.30 |
| Kotak Mahindra Bank | 4.63 | | Axis Bank | 4.46 | | Tri-Party Repo (TREP | 4.34 | | Multi Commodity Exch | 4.21 | | CarTrade Tech | 4.18 | | Ujjivan Small Fin | 4.00 | | Manipal Payment & Id | 3.78 | | OnEMI Technology | 3.62 | | One97 Communications | 3.10 | | Shriram Finance | 2.99 |
|
|
|
|
|
 Kotak Mahindra Bank Ltd. |
4.63
|
 Axis Bank Ltd. |
4.46
|
 Tri-Party Repo (TREPS) |
4.34
|
|
Multi Commodity Exchange Of India Ltd.
|
4.21
|
|
CarTrade Tech Ltd.
|
4.18
|
|
Ujjivan Small Finance Bank Ltd.
|
4.00
|
|
Manipal Payment And Identity Solutions Ltd.
|
3.78
|
|
OnEMI Technology Solutions Ltd.
|
3.62
|
|
One97 Communications Ltd.
|
3.10
|
|
Shriram Finance Ltd.
|
2.99
|
|
|
 Indicates an increase
or decrease or no change in holding since last portfolio |
|
Indicates a new
holding since last portfolio.
|
|
|
Detailed Portfolio |
|
|
|
|
Sector Allocation * (as % of equity portfolio) |
|
|
|
Sector Allocation
Chart Type : |
 |
|
*Pertains to the equity investments only. |
|
|
|
|
|
|
|
|
|
|
In / Out
|
| What's in as on 30-Sep-2026 |
What's out as on 30-Sep-2026 |
| Company Name | Mkt Value | Holdings | | (Rs.Cr) | % | | State Bank Of India | 3.1191426 | 2.9207 | | Kotak Mahindra Bank Ltd. | 4.9394067 | 4.6251 | | Arman Financial Services Ltd. | 1.4529186 | 1.3605 | | Motilal Oswal Financial Services Ltd. | 1.531257 | 1.4338 | | Asset Reconstruction Company (India) Ltd. | 0.727157569 | 0.6809 | | Manipal Payment And Identity Solutions Ltd. | 4.03847416 | 3.7815 |
|
| Company Name | Mkt Value | Holdings | | (Rs.Cr) | % | | ICICI Bank Ltd. | 5.9452606 | 6.5657 | | HDFC Bank Ltd. | 3.589667 | 3.9643 |
|
|
|
|
|
|
|
|
|
|
|
|
|
|
|
|
|
|